3D visualization
Visualization: A picture is worth a thousand words – creating digital twins of production systems in 2D or 3D
Whether it’s a microchip or a passenger plane: manufacturing products is a complex process. The production process must be meticulously planned and thought through before even a single component finds its fixed place based on the design drawings.
Visualization is playing an increasingly important role in this process. Entire production facilities, individual production lines or even just specific work steps can be digitally reproduced and simulated using 2D or 3D models. This allows potential problems, bottlenecks or optimization potential to be identified and avoided at an early stage, even before real production starts.
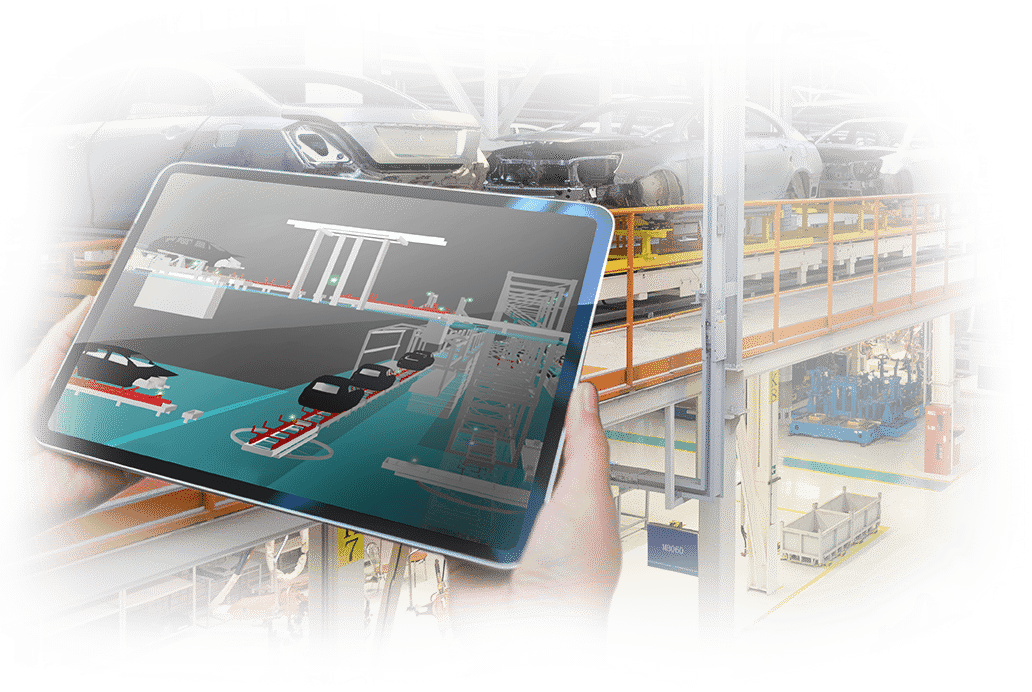
For example, an automotive plant is planning a new production line for a specific model. Instead of building expensive prototypes and carrying out elaborate test runs, the production line can be mapped virtually – as a digital twin – using 2D or 3D visualization. This allows engineers to test different layouts, simulate the movement sequences of robots and optimize the material flow – all on the computer before even a single physical action takes place in the real factory.
This digital mirror image makes it possible to later increase efficiency in production, minimize errors and ultimately save time and costs. What’s more, communication between individual departments, as well as with customers and partners, is simplified if everyone involved can access the same, easily accessible “image”.

What is visualization in production?
Visualization means presenting complex information and processes with the help of visual aids in order to make them easy to understand and use. Various media and methods are used that are tailored to the specific requirements of production.
Goals of visualization
- Transparency: to record the current status of production processes, material stocks, plant utilization, etc. at a glance
- Communication: pass on information quickly and clearly to everyone involved
- Process optimization: Identify weak points and potential for improvement in production
- Error prevention: Avoid errors through clear presentation of work instructions and process sequences
- Motivation and involvement: Involve employees more closely in process optimization through visual representations
Areas of application in production:
- Production planning and control: visualization of key production indicators (KPIs), order progress, material flow, etc.
- Shop floor management: visualization of work schedules, machine occupancy, quality data, etc. directly at the workstations
- Logistics: visualization of stock levels, material movements, delivery dates, etc.
- Quality management: Visualization of quality data, error rates, inspection results, etc.
- Maintenance and servicing: visualization of maintenance schedules, system statuses, fault messages, etc.
Visualization methods and media:
- Key figure boards: Presentation of KPIs using diagrams, tables and traffic light systems
- Digital displays: Presentation of dynamic information in real time, e.g. production progress, machine status, etc.
- Andon systems: Visual and acoustic signaling of status messages or faults in production
- Process visualization: Representation of process sequences using flow charts, swim lane diagrams, etc.
Advantages of visualizations in production
-

Improved communication and collaboration
-

Increased production efficiency
-

Reduction of errors and waste
-

Increased transparency and control
-

Improved decision-making
-

Increased employee motivation
How do companies that visualize with digital 2D and 3D software benefit?
2D and 3D visualizations play a particularly important role in various areas of manufacturing companies and make a significant contribution to increasing efficiency and quality assurance.
1. 2D visualization
2D visualizations provide a two-dimensional representation of objects and processes. They are used in the form of:
2. 3D visualization
3D visualizations offer a realistic, three-dimensional representation of objects and processes and open up new possibilities for manufacturing companies in terms of:
How does 2D and 3D visualization work in series production with E-MES from FORCAM ENISCO?
The E-MES shop floor solution from FORCAM ENISCO enables the creation of digital twins of production systems in 2D or 3D. This offers a number of advantages:
Functionality:
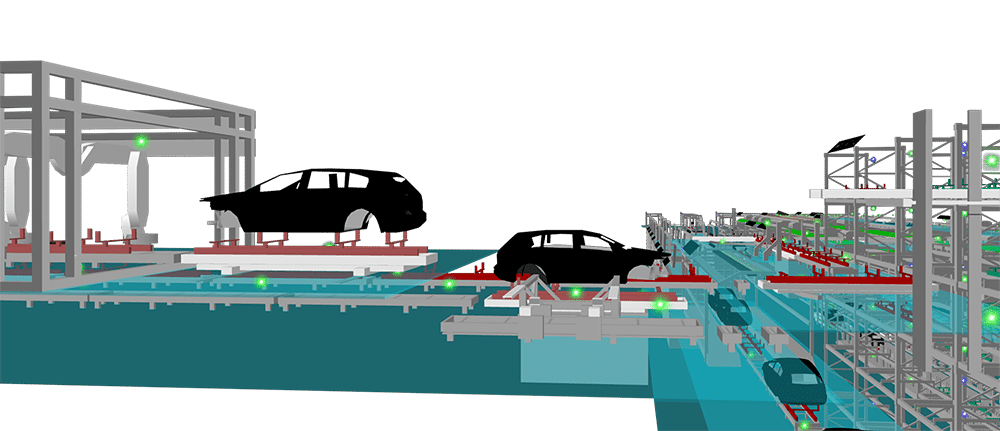
- Object creation: visualization is based on 3D objects, which can either be imported from the standard library or created in the object editor itself.
- Scene structure: By preparing objects into scenes, the real production plant can be completely mapped virtually.
- Data linking: The objects are linked with production data to create a real-time model of the plant. For example, material flows, machine statuses and process progress can be visualized.
What are the advantages?
- Transparency: The 3D visualization provides a comprehensive overview of the entire production, processes and movement sequences.
- Error analysis: A replay function enables detailed analysis of error situations. This makes it easier to identify and rectify causes and correlations.
- Fast fault assignment: Faults and messages can be assigned directly to a specific system part or machine, which speeds up troubleshooting.
- Efficient planning: The 3D visualization as a digital twin serves as the foundation for simulations and planning tasks in order to optimize production and avoid bottlenecks. The editor makes visualization even more efficient.
- Improved communication: 3D visualizations facilitate communication between the different areas of production and thus promote collaboration.
What are the special features?
- 2D & 3D visualization: In the E-MES solution, it is possible to visualize in both 2D and 3D formats, depending on requirements and needs.
- Product Card App (PCA): The PCA bundles all relevant data for each manufactured product in one app. This ensures access to information on product quality, process analyses, etc. at all times.
The patented 2D and 3D visualization in the E-MES solution from FORCAM ENISCO is a powerful tool for series production with partially or fully automated processes. It increases transparency, simplifies error analysis and contributes to the optimization of production processes.
Expert opinions: