Fishbone Ishikawa Diagram: How to Solve Problems in Production Faster
The fishbone diagram, also referred to as the Ishikawa diagram, is a highly effective tool to identify the root causes of problems. It provides a structured approach to problem-solving and process analysis. In this blog post, we’ll explore how to effectively use this method, with a strong emphasis on manufacturing processes.
Why do you need a fishbone diagram?
The fishbone diagram helps you to systematically develop solutions to problems. This method is beneficial when the root causes of errors or waste are unknown.
Overview of the fishbone diagram
The Ishikawa diagram was developed by Kaoru Ishikawa, a Japanese chemical engineer and pioneer of quality management, in the early 1940s. His aim was to provide companies with a simple but effective tool to systematically analyze the causes of problems and find solutions.
The fishbone diagram is one of the seven basic quality tools to help companies achieve Total Quality Management (TQM). It quickly became a standard tool in quality management and is widely used in manufacturing, project management, and process optimization.
The objectives
- Systematic cause analysis
- Quality improvement
- Simple visualization
- Promotion of teamwork
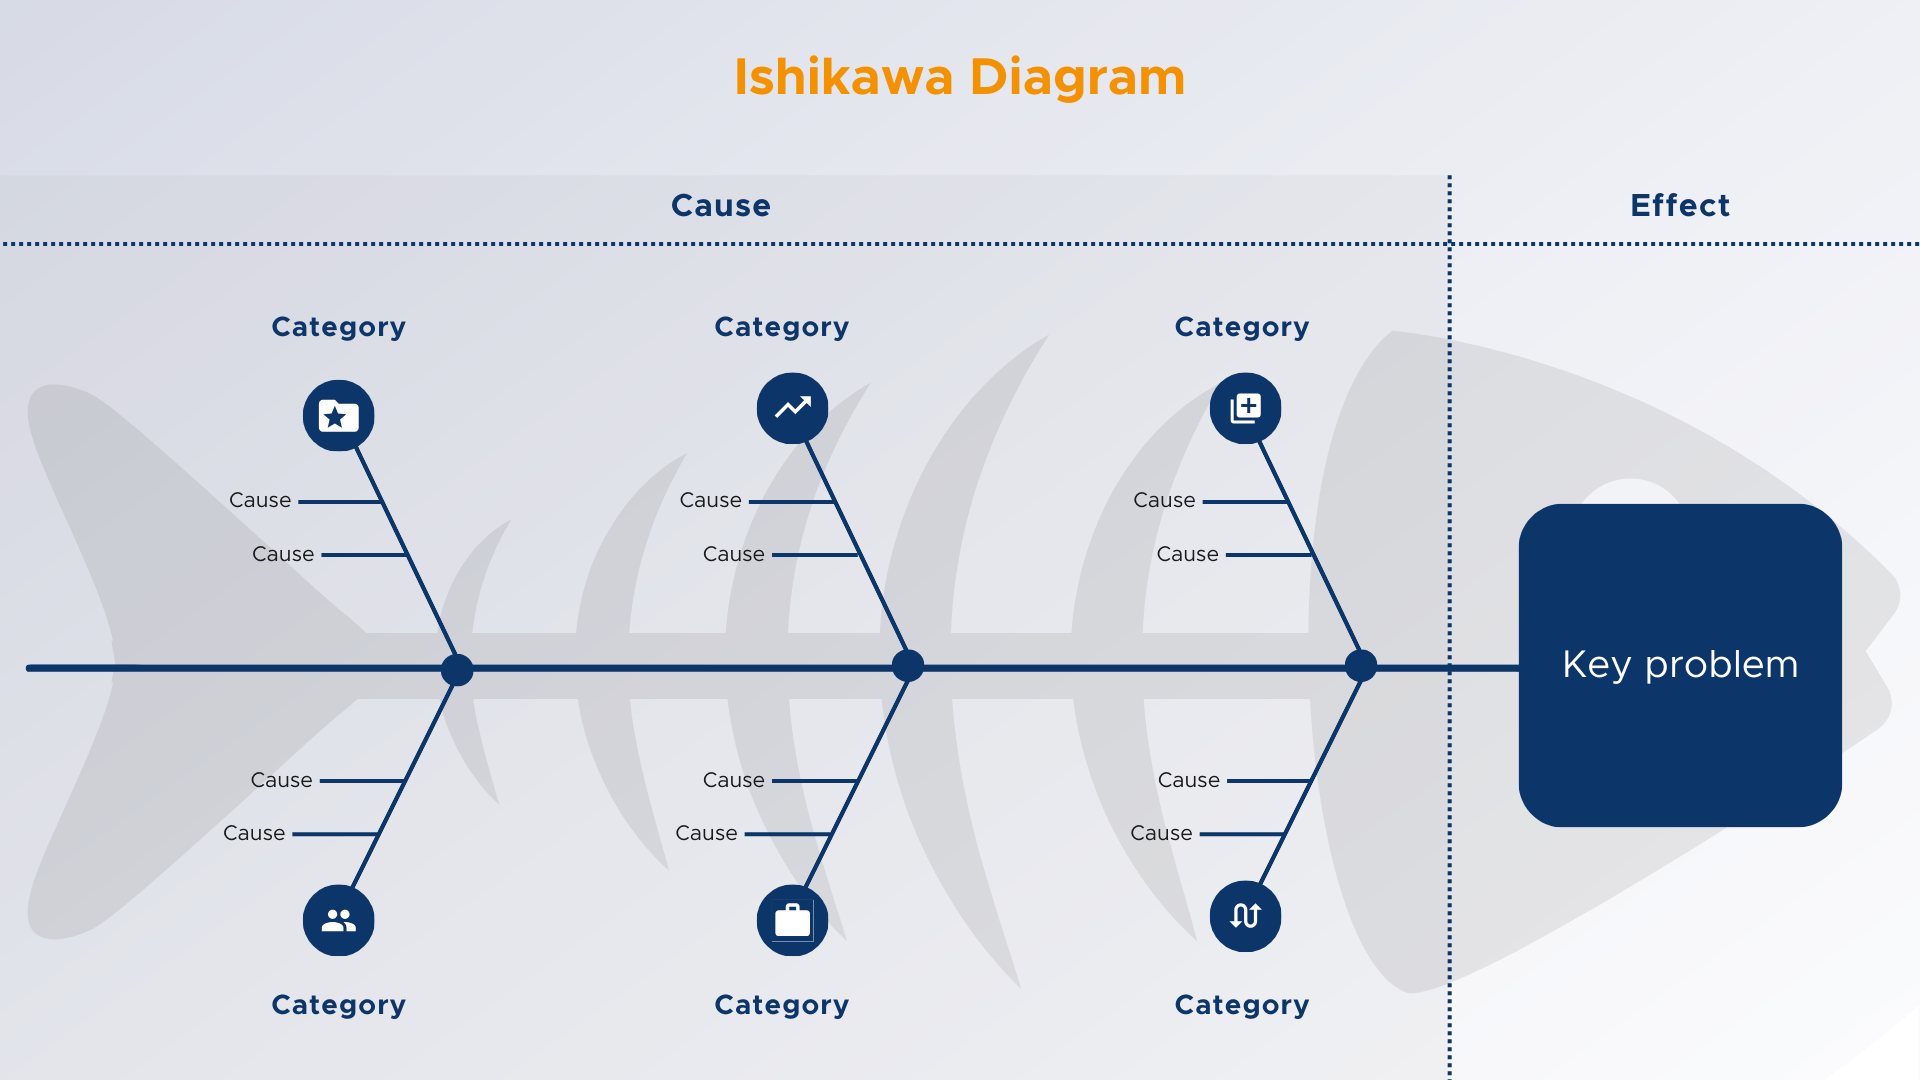
The structure
The fishbone diagram resembles a fish skeleton and consists of the following components:
- The problem statement or undesired effect is written in the fish’s head.
- The fish bones are the leading causes or categories that branch off from the “head”. Typically, the 5M method, 6M method, 7M method, or 8M method are used for the categories.
- The sub-branches are the contributing factors and causes for each category.
Depending on the level of detail required, you can use the “M” methods, including 5M, 6M, 7M, and 8M.
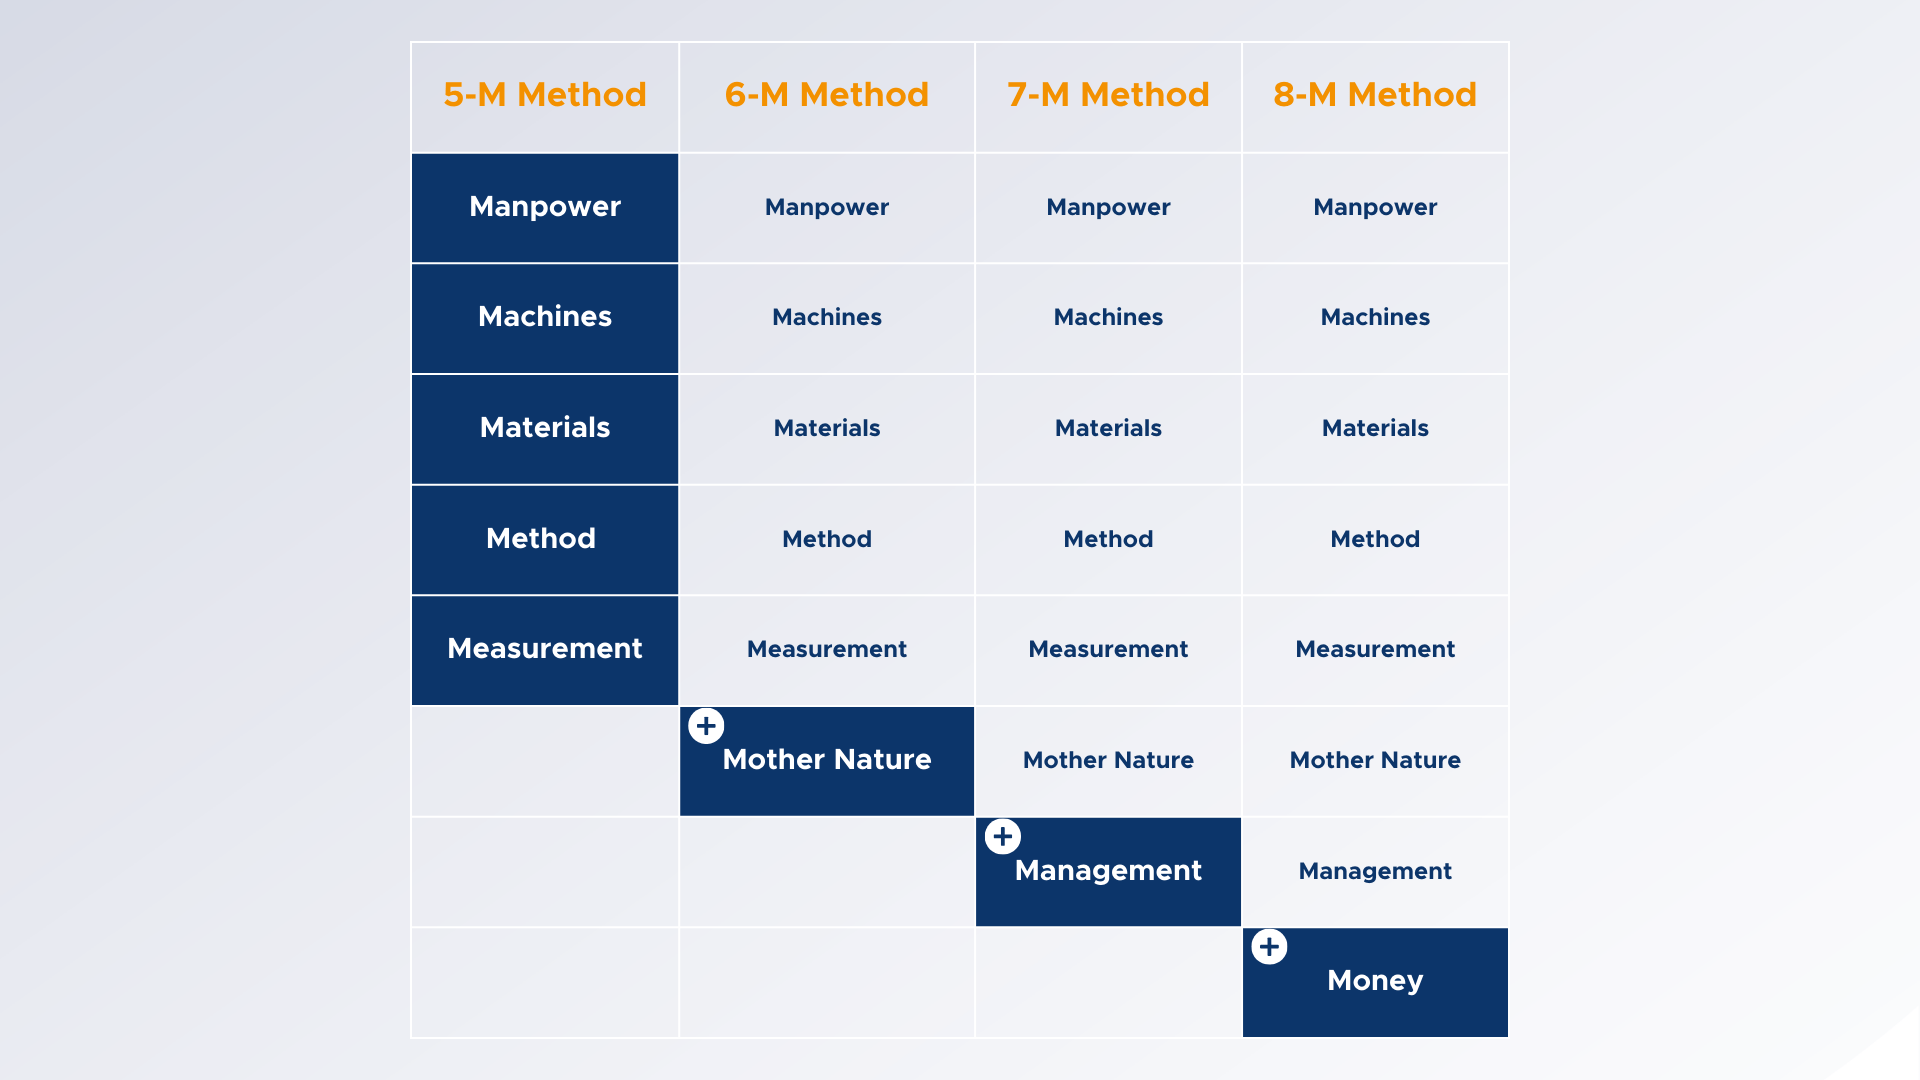
- Manpower (qualification, training, motivation, human error)
- Machines (machine condition, maintenance, operation, age of machine)
- Materials (quality of raw material, availability, specifications)
- Method (procedures, processes, work instructions, standards)
- Measurement (measurement methods, calibration, measurement errors, accuracy of measuring instruments)
- Mother nature (environmental influences such as temperature, light, noise, working environment)
- Management (management decisions, organization, planning, resource allocation)
- Money (financial resources, budgeting, costs, investments)
You can define your own categories if necessary.
When should you use the fishbone diagram?
You do not know the causes of a problem
This method is helpful when the cause of a problem is unknown. You can systematically identify potential root causes that build the foundation to develop solutions.
You want to include different perspectives
It is often used in group settings and team discussions. Diverse perspectives and expert opinions contribute to a more comprehensive analysis during brainstorming sessions. This collaborative approach helps uncover hidden causes, fosters deeper insights, and promotes a well-rounded problem-solving strategy.
You want to improve processes and products in a targeted way
It is often used in quality improvement processes such as Six Sigma or Total Quality Management (TQM). It helps to identify the major causes of quality issues.
6 steps to go to the bottom of any problem
- Define the problem
- Determine the categories
- Collect causes
- Analyze causes
- Prioritize causes and derive measures
- Review and adjust measures
1. Define the problem
Formulate the problem clearly. All participants must be able to understand the problem. Write down the defined problem in the “head” of the fishbone diagram you want to focus on.
Tip: Make sure you invite the experts you need for the respective categories.
2. Determine categories
Select the categories based on your problem definition, or define your own as needed. Choose the necessary categories.
To-do’s on the Ishikawa diagram: Draw these categories as main bones of the fish.
3. Collect causes
Identify the causes based on the defined categories. These can also be further subdivided into main and secondary causes.
Discuss the possible causes openly and in detail with your team. Try to collect as many disruptive factors as possible. Work through all the categories systematically. This will ensure that you consider all aspects. You can use sticky notes.
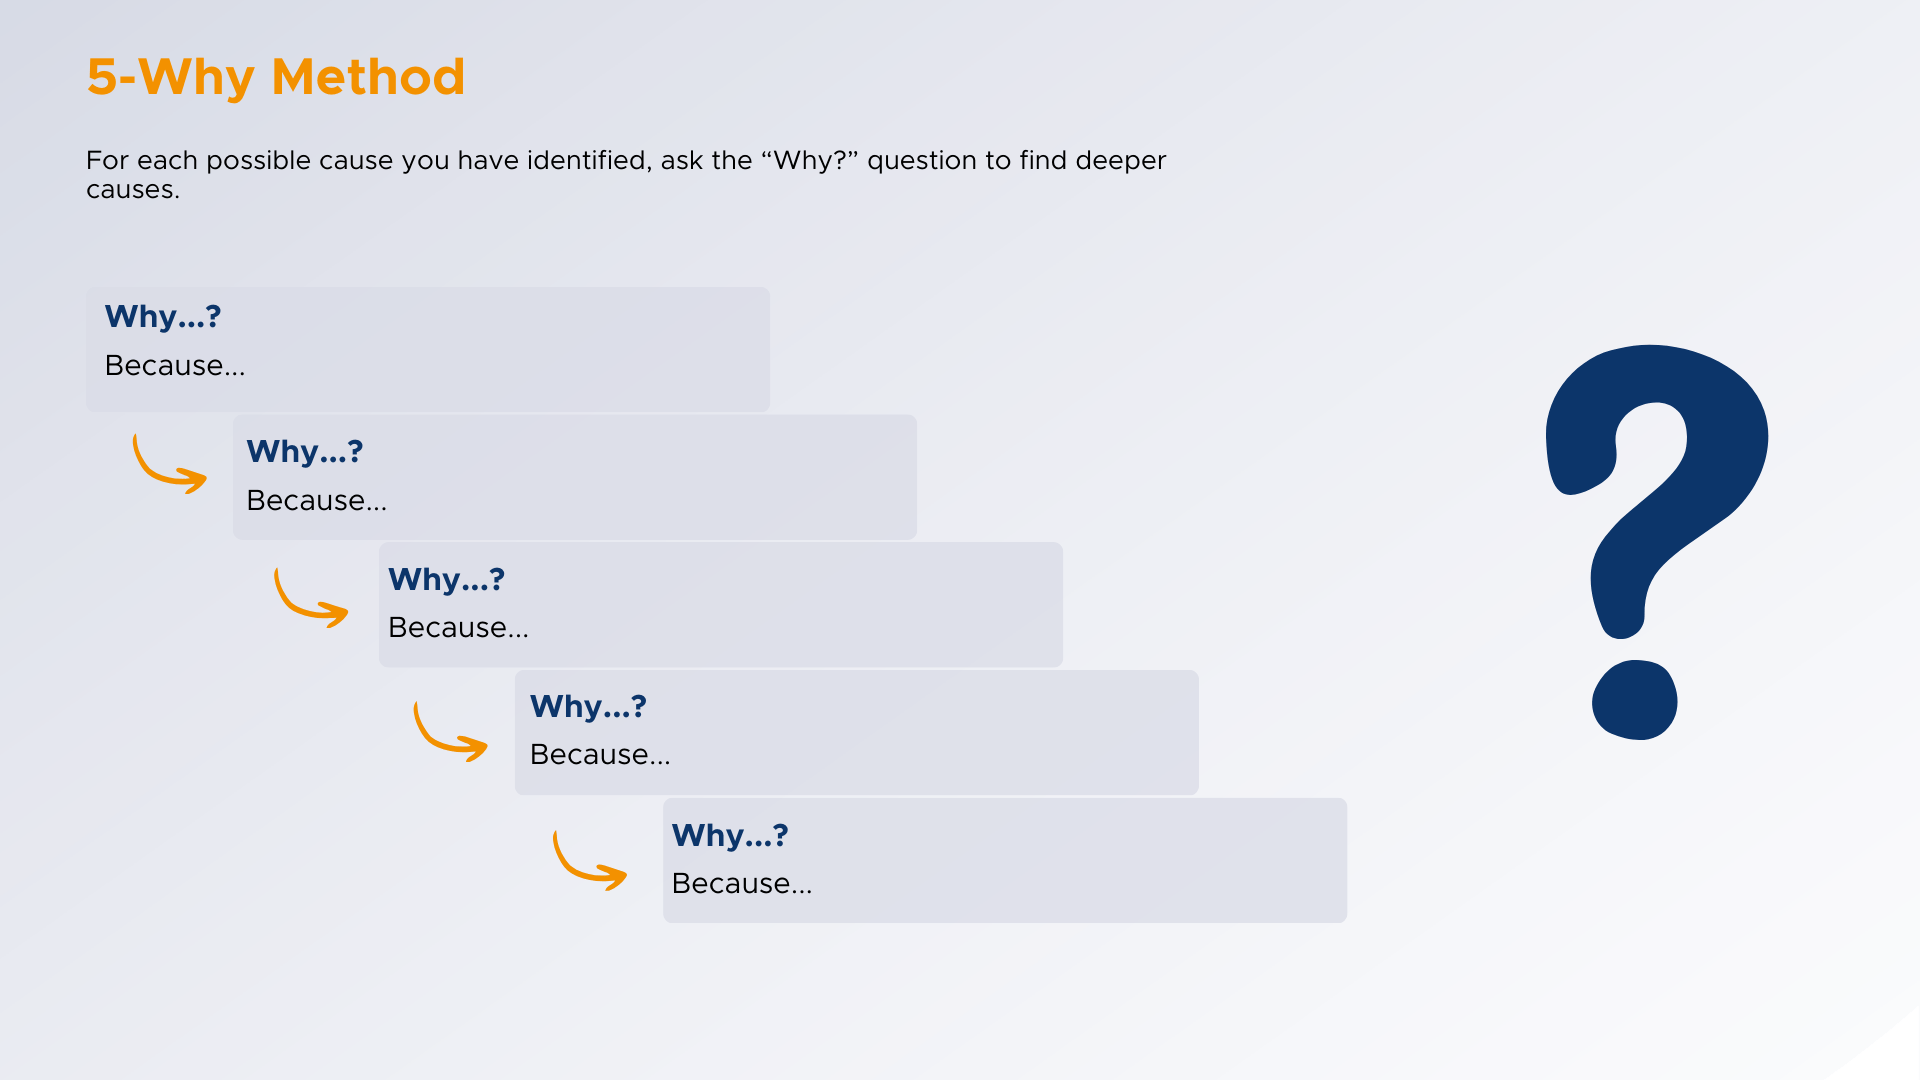
If possible, get to the bottom of the causes to find the root of the problem. The 5 Why’s method offers an approach to get closer to the possible root cause. Also make sure to collect causes for each category.
Add the possible causes as side branches of the main branches.
4. Analyze causes
Go through the collected causes and analyze which ones are most likely to cause the problem.
- Get to the bottom of it with the 5-Why method
- Add sub-causes as further branches
Tip: Adding the creation date and the people involved increases the traceability of an Ishikawa diagram. For example, if important participants have not been included in the cause analysis, this can be done later in time.
5. Prioritize causes and derive measures
- Evaluate the collected causes in the team according to their importance and probability
- Derive measures to solve the problem sustainably.
- Plan the solutions or improvement measures
- Create action plans to eliminate the main causes
- Create commitment: All parties agree on the next steps, responsibilities are clearly defined.
Tip: Use sticky dots to vote, so that participants can quickly and visually indicate their preferences. This method facilitates decision-making and ensures a transparent opinion-forming process. It also shows which causes are considered particularly critical and which measures should have priority.
6. Review and adjust measures
After implementing the measures, check whether the problem has been solved.
If necessary, adjust the Ishikawa diagram when new causes are identified.
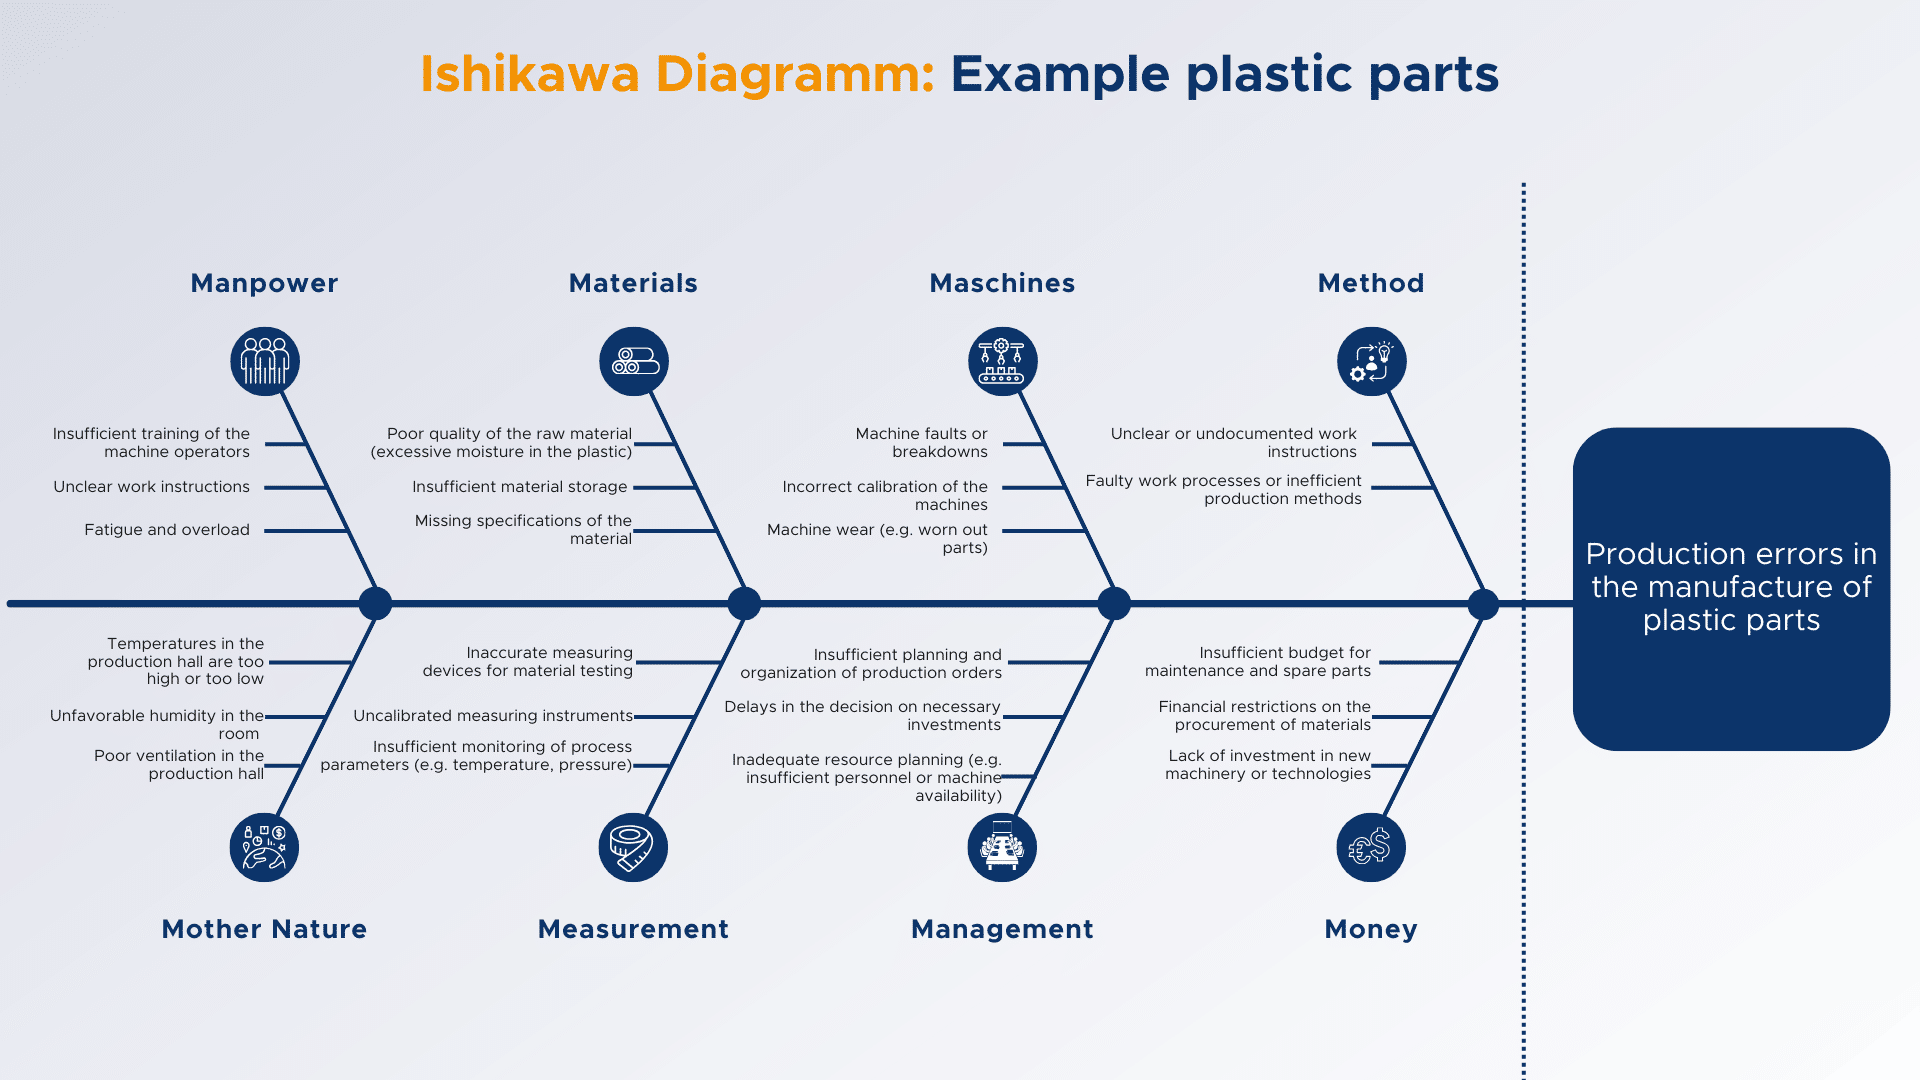
Example: plastic parts
What might such an analysis process look like in practice? The individual steps are examined in more detail using a fictitious example from the plastics processing industry.
Problem: A manufacturing company has noticed that plastic parts are regularly being produced with defects. The defects range from material cracks to uneven surfaces. This leads to increased scrap rates and delays in production.
Goal
The company’s goal is to sustainably improve the quality of the plastic parts.
Procedure
- Problem definition: The team clearly defines the problem: “Defective plastic parts during production.”
- Categorization: Using the 8-M method, potential causes are examined in the categories of people, machines, materials, methods, environment, measurement, management and money.
- Brainstorming: Experts from various departments gather possible causes for each category in a moderated session.
- Prioritization: After identifying the causes, a sticky dot method is used to determine which causes are most likely to be responsible for the defects.
- Analysis and measures: The prioritized causes are analyzed in detail and measures to solve the problem are defined.
Result
The company identifies inadequate material storage and a lack of training for operating personnel as the main causes of the defects. The scrap rate drops significantly after implementing measures such as introducing clear storage standards, maintaining the machines, and targeted training.
Templates
Are you looking for a template?
- We offer you a PPT with the fishbone diagram for free download
- Are you looking for an interactive tool? With Miro, you can work on the Ishikawa diagram together as a team at the same time: https://miro.com/de/templates/fischgraetendiagramm/
Summary
The Ishikawa diagram offers a systematic approach to identifying the causes of problems and supports teams in working together effectively and developing sustainable solutions. Whether in quality management, production or decision-making – the method can be used flexibly and helps to sustainably improve processes and results.